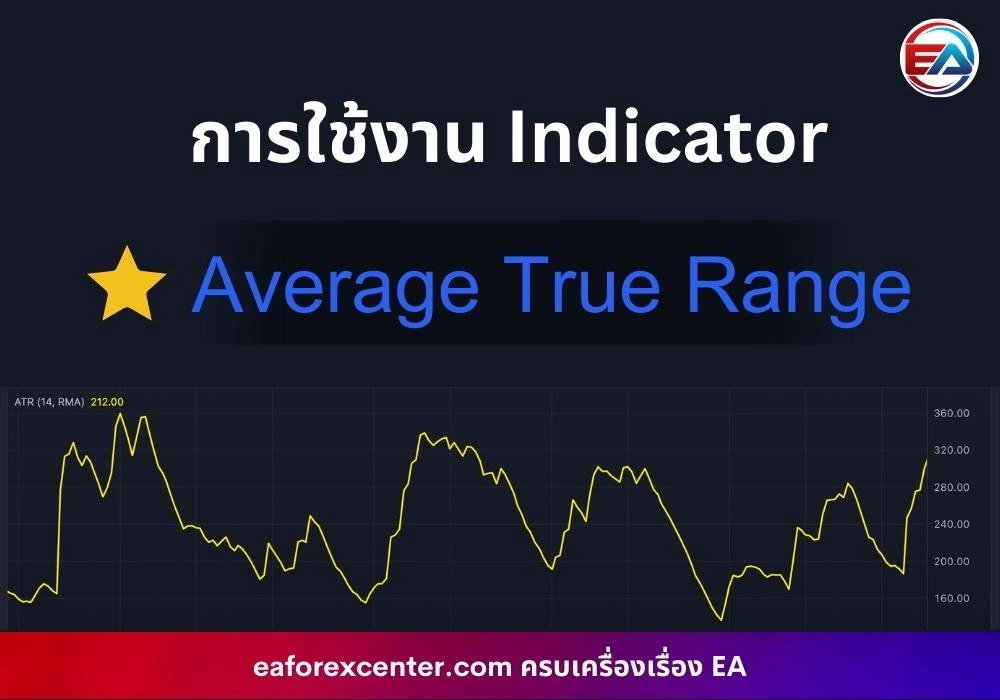
Average True Range (ATR) is an indicator that only measures market volatility. It cannot be used to predict whether prices will rise or fall, nor can it indicate trends or reversals. It may or may not be suitable for some traders, but if you think it’s appropriate and interesting, let’s see how this ATR can help us generate profits.
History of Average True Range (ATR)
Average True Range (ATR) was created and developed by technical analyst J. Welles Wilder Jr. He described this indicator in his book “New Concepts in Technical Trading Systems (1978)“. Additionally, RSI, Parabolic SAR were also created by Welles Wilder.
Using and Setting Up the Average True Range Indicator
- TradingView
Click on Indicator in the top bar >> Type “ATR” >> Click on the top result
For Input settings, no additional adjustments are needed. Use the default values, but you can adjust the color in Style for better visibility.
- MT4
Click Insert in the top bar >> Indicator >> Select Average True Range
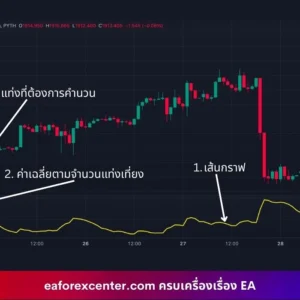
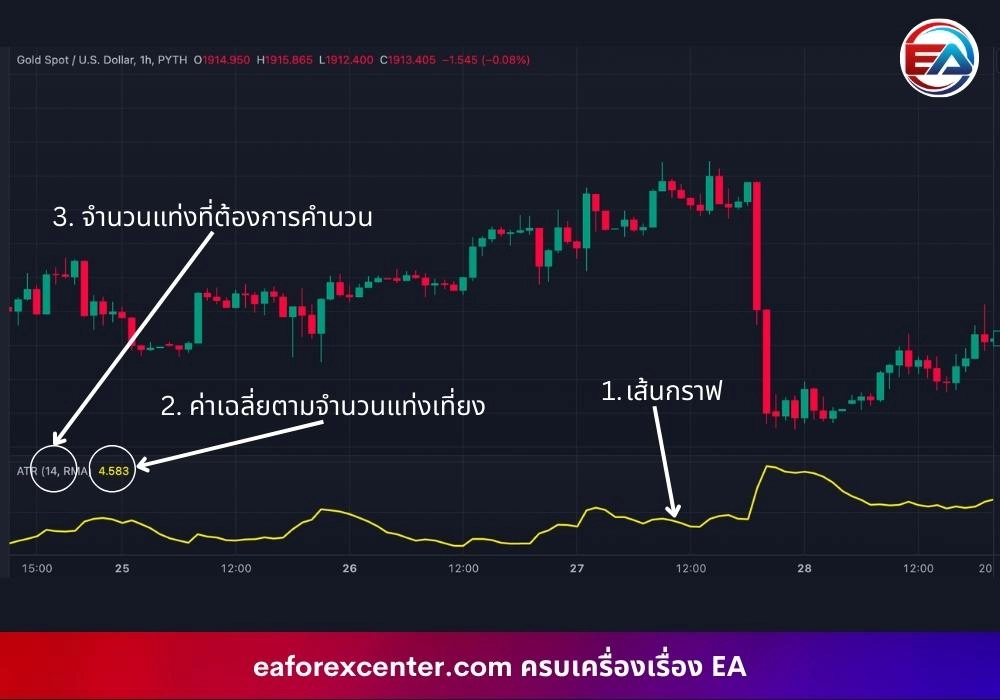
Basic Interpretation of Average True Range (ATR)
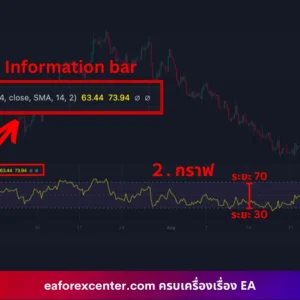
ATR consists of 3 components:
1. Graph line
- If the graph moves up, it means the market has higher volatility (both price increases and decreases)
- If the graph moves down, it means the market has lower volatility (both price increases and decreases)
2. Average of the last 14 candlesticks
- For Forex market, it’s the average of PIPs for the last 14 candlesticks
- For Stock Market, it’s the average of Baht amount for the last 14 candlesticks
*This number will change according to the selected time frame
3. Number of candlesticks used in calculation
- The default value is set to 14. It’s recommended not to change this setting.
Statistical Calculation Formula for Average True Range (ATR)
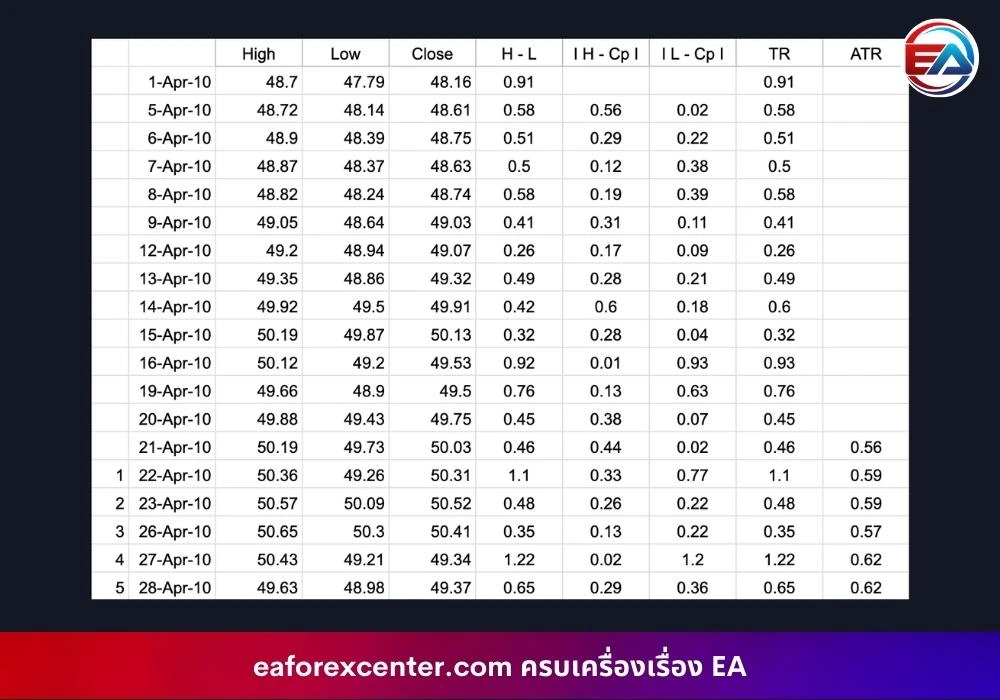
First, we need to understand True Range (TR). TR can be calculated using these 3 methods. Read carefully and try to understand:
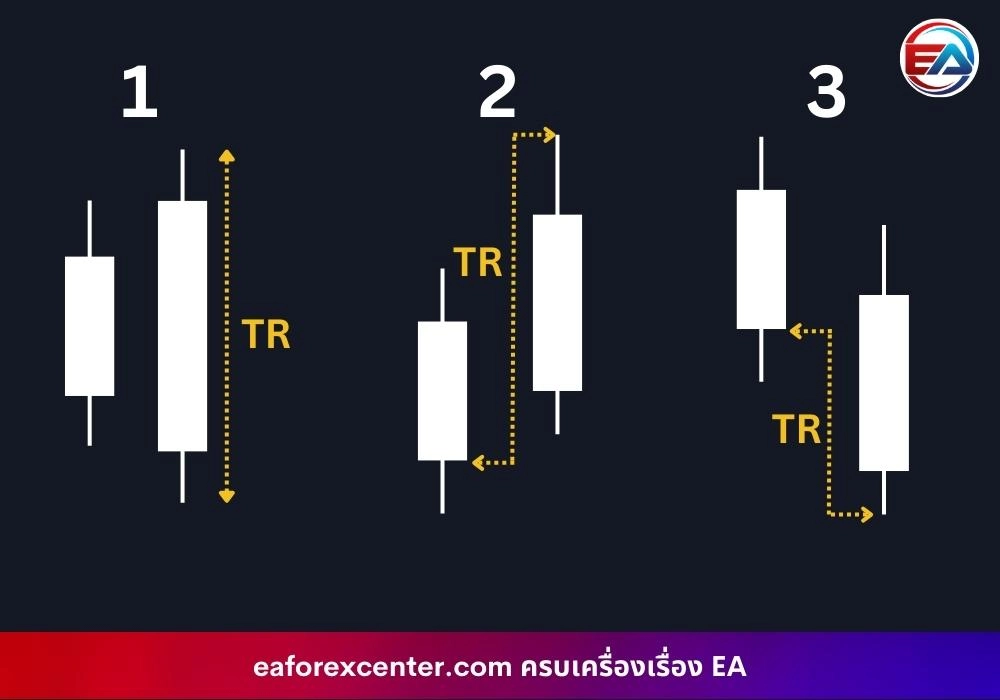
- When the current bar’s high > previous bar’s high and current bar’s low < previous bar’s low, TR = difference between high-low of the current bar
- When the current bar’s high > previous bar’s high and current bar’s low > previous bar’s low, TR = difference between current high – previous bar’s close
- When the current bar’s high < previous bar’s high and current bar’s low > previous bar’s low, TR = difference between current low – previous bar’s close
If you’re still unsure, you can refer to the table image below…
Once we have the TR value, the ATR calculation formula is:
ATR = [(Previous ATR * (n – 1) + TR] / n
- n = number of candlesticks used to calculate the average, default is 14
When substituting values, the formula becomes:
ATR = [(Previous ATR * 13) + TR] / 14
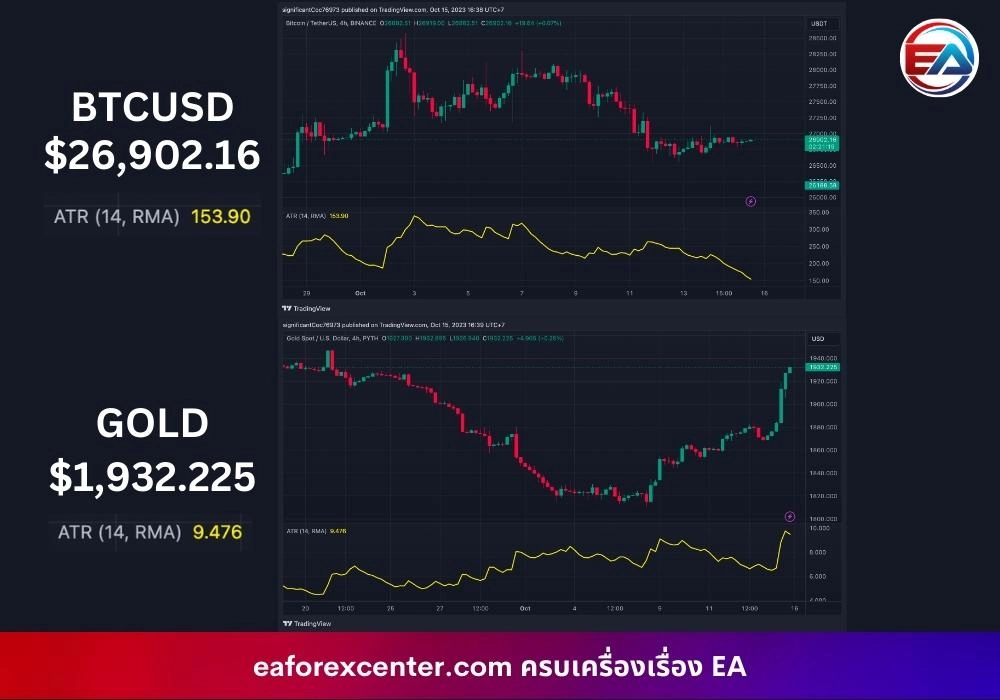
However, ATR is derived from the difference in asset prices, not calculated as a percentage. Assets with higher price numbers will have higher ATR, and assets with lower price numbers will have lower ATR. Therefore, ATR values cannot be used for comparison.
How to Use Average True Range (ATR)
The usage method aligns with the basic interpretation section regarding the graph line. The most suitable time to enter an order is when the ATR line direction changes and points upward. However, as mentioned, ATR cannot predict price direction. Therefore, it should be used in conjunction with other indicators or technical and fundamental factors to decide whether to Buy or Sell.
Recommended Time Frames
ATR can be used in all time frames but cannot be used for cross-time frame analysis. For example, if you analyze on 1H but place an order on 4H. Once you choose a TF to trade, you must stick to that TF only, as ATR values differ across TFs and cannot be referenced between them.
Using ATR to Set Stop Loss
Divided into 2 cases: Buy side and Sell side
● Buy side
Calculation formula: SL = Current Price – [ATR * 2]
Suppose we Buy gold at $1919 and at that moment ATR is 8.662. After getting the numbers, substitute them in the equation as follows:
SL = 1919 – [8.662 * 2]
SL = 1919 – 17.324
SL = 1901.676
● Sell side
Calculation formula: SL = Current Price + [ATR * 2]
Using the same conditions but changing to Sell, we get the SL price as follows:
SL = 1919 + [8.662 * 2]
SL = 1919 + 17.324
SL = 1936.324
Therefore, when the market is highly volatile, ATR will be high, and the SL range will be wider. Conversely, in a sideways market, ATR is low, and the SL range will be narrower.
However, if you want to use other factors or techniques to set SL yourself, you can do so as well.
Summary
Average True Range is an indicator that shows market volatility. It’s not a tool that indicates direction, trend, or tendency like RSI, MACD, or EMA. Instead, it’s used to observe market breakouts and find suitable SL points.
อ้างอิง
- https://learn.tradimo.com/technical-analysis
- https://www.caf.co.th/article/stop-loss-atr
- https://www.lucid-trader.com/average-true-range-indicator/
- https://www.fidelity.com/learning-center/trading-investing/technical-analysis/technical-indicator-guide/atr
- https://fbs.com/analytics/guidebooks/average-true-range-223
- https://www.investopedia.com/terms/a/atr
Eaforexcenter Team
Be the first to review “Average True Range”
Related products


Reviews
There are no reviews yet.