
Abridged Version
- Stochastic Oscillator (STO) is an Oscillator type tool that helps indicate Overbought/Oversold and market volatility
- STO can be used in both Sideway and Trend charts
- STO should be used in conjunction with other techniques and indicators
Stochastic Oscillator What is it, history, statistical formula, easy-to-understand usage
Abstract: Stochastic Oscillator, abbreviated as (STO), is one of the most popular indicator tools in Thailand due to its ability to measure market volatility quickly and certainly faster than RSI… However, it’s not better in every aspect and has some drawbacks. This tool has its own unique usage methods. We’ll explore how to use it, its history, and special techniques.
History of Stochastic Oscillator
The Stochastic Oscillators was invented and developed by George C. Lane in the late 1950s. It gained popularity and is still used today. ‘Stochastic’ means ‘random’ in Greek.
Statistical formula of Stochastic Oscillator
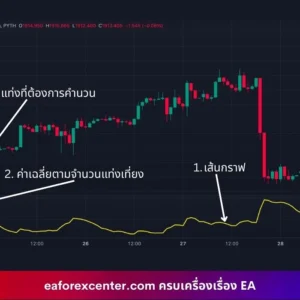
The Stochastic Oscillators formula consists of two parts: %K and %D. The STO indicator input in MT4 can be adjusted for Slowing, Price field, and MA method. The explanation of usage will be in the next section. The formulas for %K and %D are as follows:
- %K =100 [ ( Current – L(n) ) / ( High(n) – Low(n) ) ]
- Where
- Current = Current price
- High(n) = Highest price in n days
- Low(n) = Lowest price in n days
- %D = Average of %K
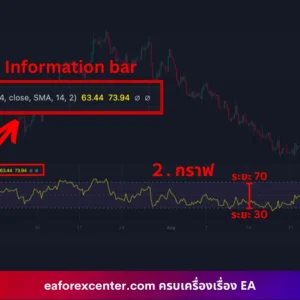
Note: Stochastic Oscillator values range between 0 – 100%
When Sto > 80, it indicates Overbought condition, and when Sto < 20, it indicates Oversold condition
Basic usage settings
How to use Stochastic Oscillator

- Open MT4 window, look at the menu bar, select Indicators
- Then choose Oscillators and click on Stochastic Oscillators
How to set Parameters
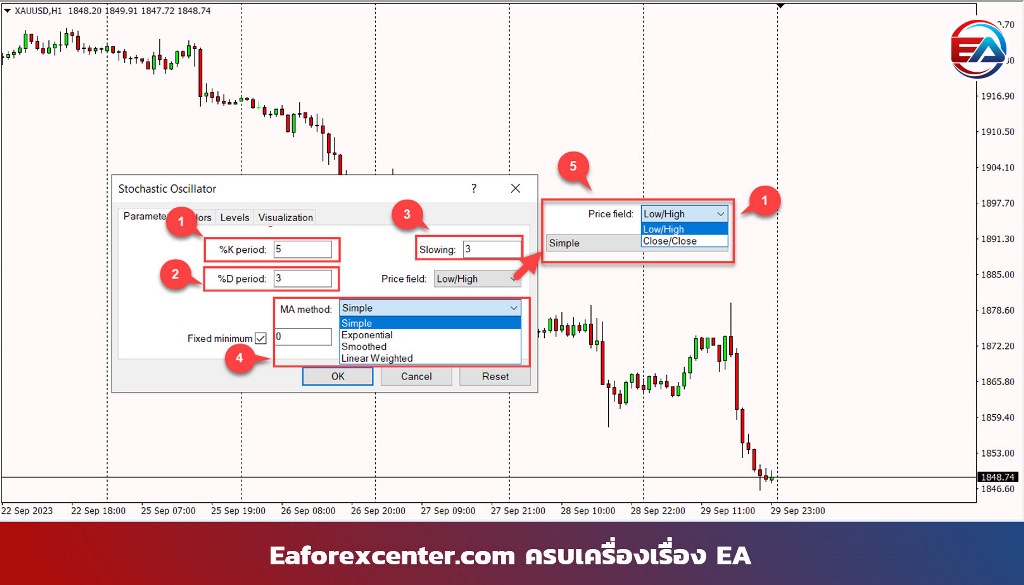
- %K period: Can be set as desired by entering the number of candles to be used. Commonly used numbers are 5, 9, and 14 days, depending on the volatility of the currency pair.
- %D period: The average of %K value, calculated as a Moving Average line. Usually set to 3.
- Slowing: The weight delay of the graph line, usually set to 3.
- MA method: The calculation method for the Moving Average line.
- Price field: The type of candle price to be used in the calculation.
How to set Colors
- Main: The line of %K period. You can choose color and graph line type as desired.
- Signal: The line of %D period. You can choose color and graph line type as desired.
How to set Levels
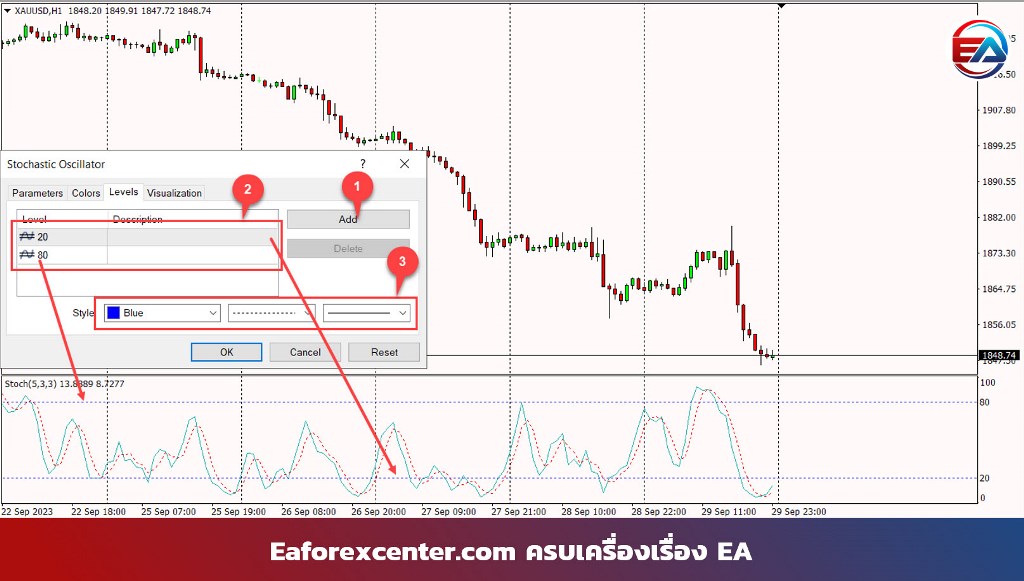
- Add: Add desired level
- The level will appear here and can be edited
- You can choose color and graph line type as desired
How to use Stochastic Oscillator
Recommended Time Frame
Stochastic Oscillators is quite a flexible indicator. It can be used from Time Frame (Min) to Time Frame (Months). However, this depends on individual usage techniques and indicator parameters.
Suitable trading system/market conditions
The recommended trading system and market conditions for using Stochastic Oscillators can be both Sideway and Trend states, with different usage methods for each condition… But overall, it’s suitable for short-term buying/selling only because Stochastic Oscillators signals are quite fast and quick.
Usage examples
1. Using Stochastic Oscillators in Trend conditions
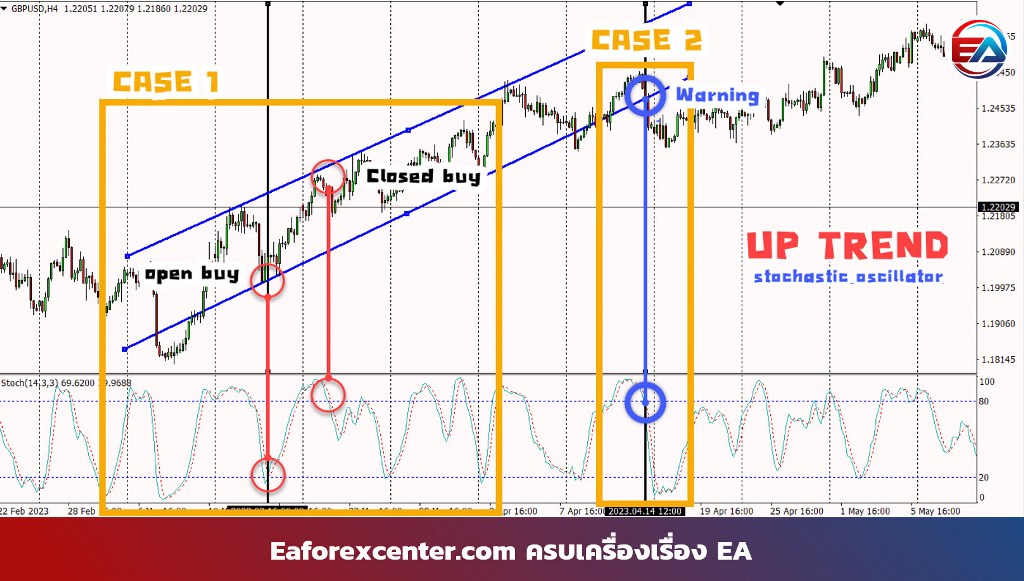
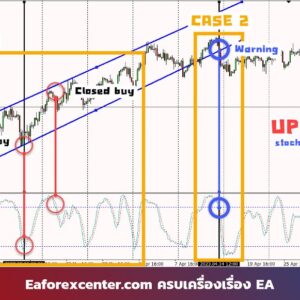
How to use Stochastic Oscillators in Trend conditions
- Look for a trend, such as Up Trend or Down Trend
- Draw support and resistance lines
- In case of Up Trend (case1), wait for the graph to retest the support
- Stochastic Oscillators < 20 or Oversold occurs
- Stochastic Bullish Cross Over occurs, green line crosses red line upwards, then Buy
- Close Buy when Stochastic Oscillators > 80 along with hitting resistance
- Caution: False signal in Case 2 (Recommended to use other indicators for decision making)
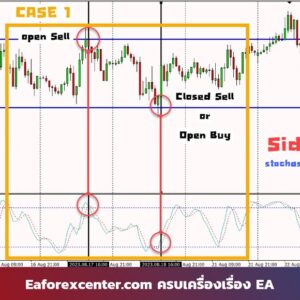
2. Using Stochastic Oscillator in Sideway conditions
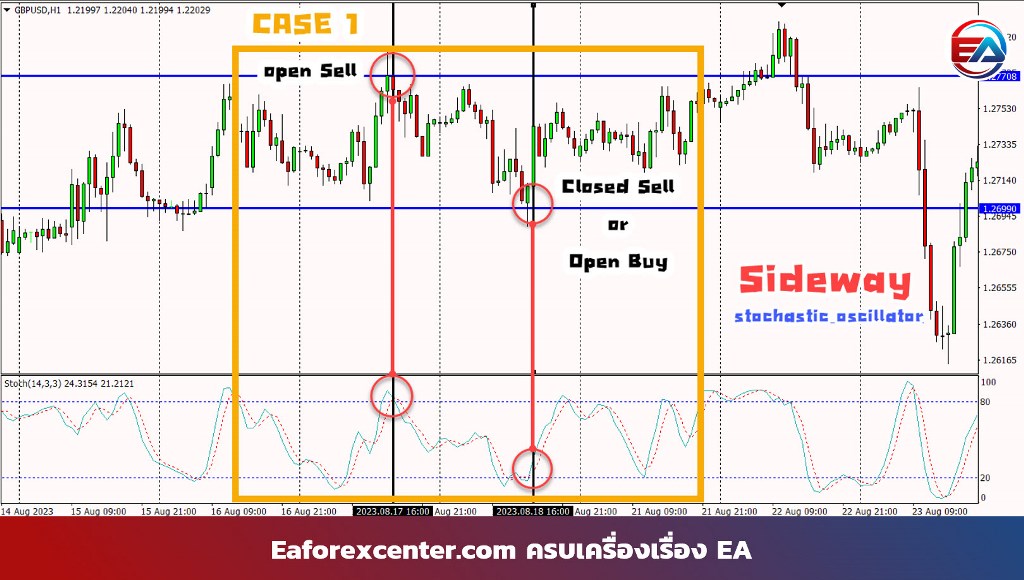
How to use Stochastic Oscillators in Sideway conditions
- Look for Sideway trend
- Draw support and resistance lines
- In Case 1, wait for the graph to retest the resistance
- Stochastic Oscillator > 80 or Overbought occurs
- Stochastic Bearish Cross Over occurs, green line crosses red line downwards, then Sell
- Close Sell when Stochastic Oscillators < 20 along with hitting support
Strengths and weaknesses of Stochastic Oscillators
| Strengths | Weaknesses |
| Can indicate position (Overbought/Oversold) | May give false signals during Strong Trend |
| Easy to use and has few variables | Low accuracy, should be used with other indicators |
| Can be used in various Time Frames | Lagging Indicator, causing delay in signal indication |
| Due to its popularity, it’s easily available on all platforms | |
| Can indicate Divergence |
Note: Using Stochastic Oscillators should be part of a strategy and shouldn’t rely on a single indicator. It’s recommended to add other indicators or combine various trading techniques.
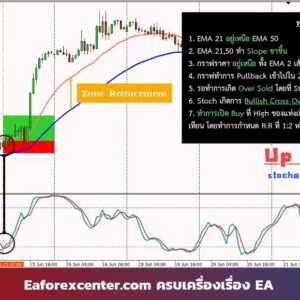
Combining Stochastic Oscillators with EMA using Swing Trade approach
Using Stochastic Oscillator and EMA in Up Trend
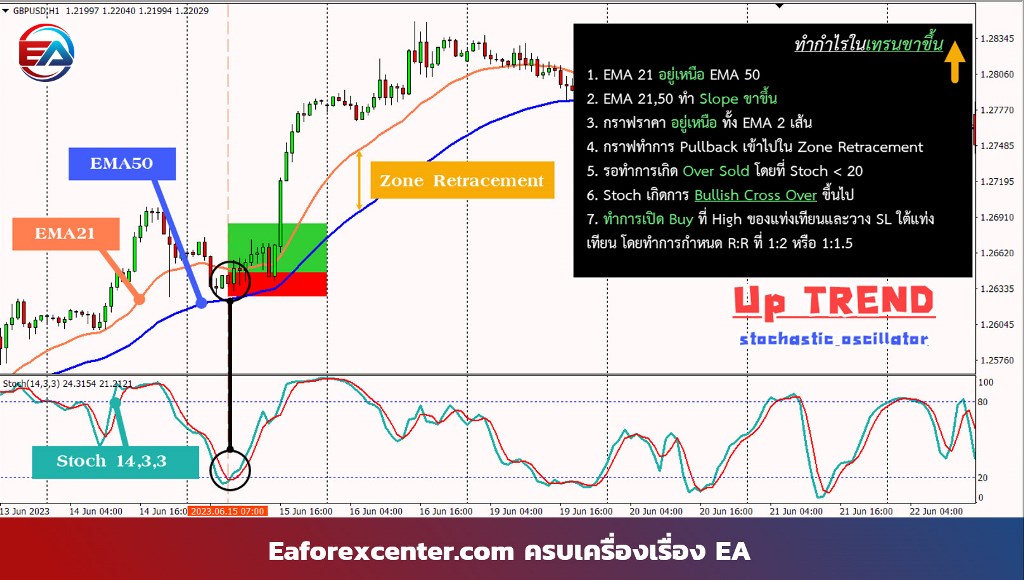
How to use in Up Trend conditions
- EMA 21 is above EMA 50
- EMA 21,50 make upward Slope
- Price chart is above both EMA lines
- Chart Pullback into Retracement Zone
- Wait for Oversold to occur with Stoch < 20
- Stoch shows Bullish Cross Over upwards
- Open Buy at candle High and place SL below the candle, setting R:R at 1:2 or 1:1.5
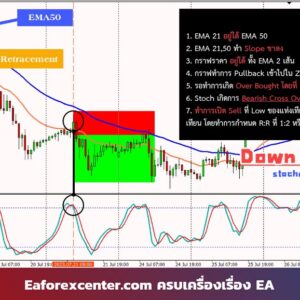
Using Stochastic Oscillators and EMA in Down Trend
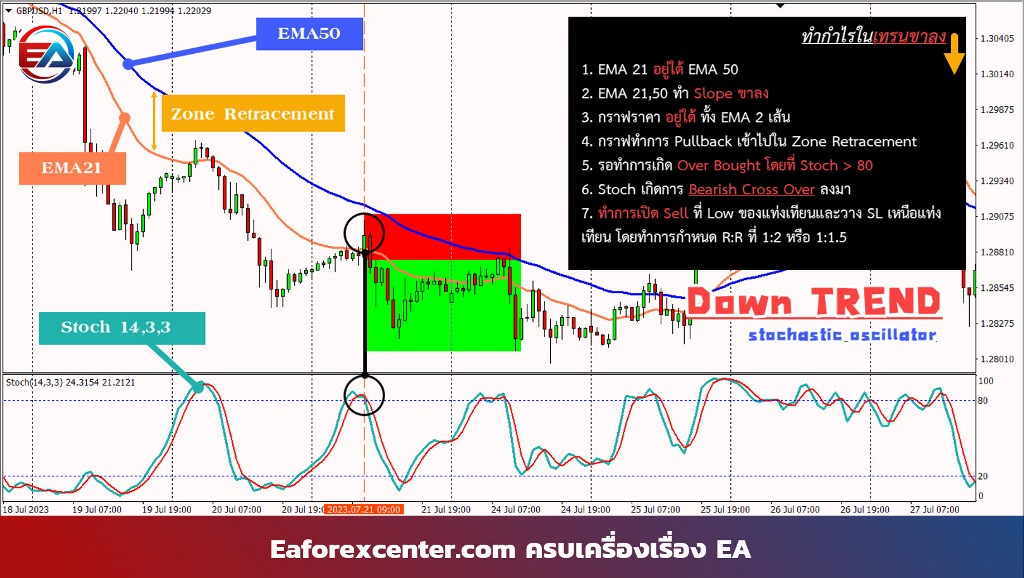
How to use in Down Trend conditions
- EMA 21 is below EMA 50
- EMA 21,50 make downward Slope
- Price chart is below both EMA lines
- Chart Pullback into Retracement Zone
- Wait for Overbought to occur with Stoch > 80
- Stoch shows Bearish Cross Over downwards
- Open Sell at candle Low and place SL above the candle, setting R:R at 1:2 or 1:1.5
“Failure” is “Success” if we “Learn” from it
Summary
Stochastic Oscillators is quite a good tool… If used properly and known well enough, it can make profits for us without much difficulty… But we must admit that Sto sometimes still gives false signals occasionally. Therefore, it’s essential to use Sto in conjunction with other techniques or other indicators, which would be excellent.
The eaforexcenter team
Be the first to review “Stochastic Oscillator”
Related products


Reviews
There are no reviews yet.